This is an old revision of the document!
Appendix E: All Columns Test Result Curves
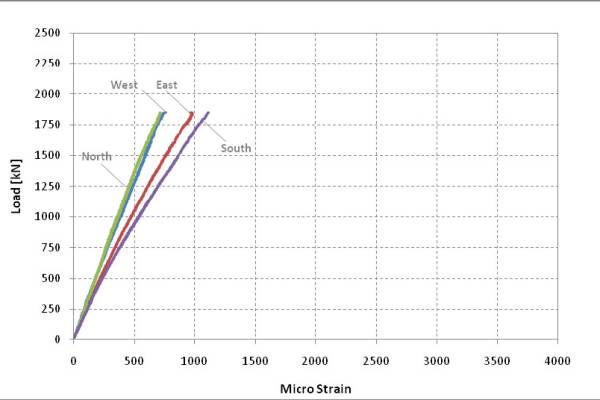
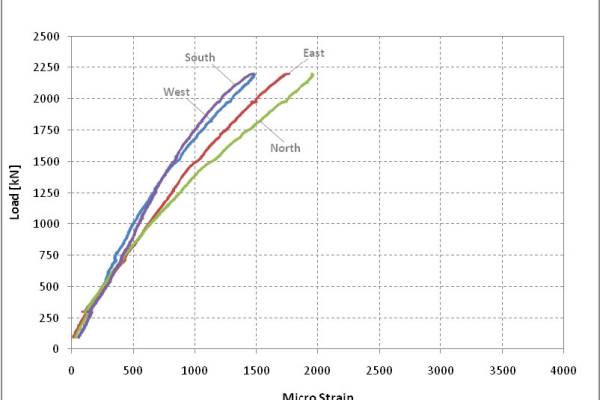
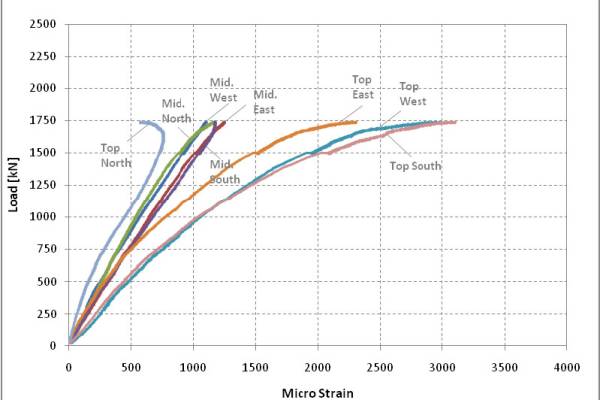
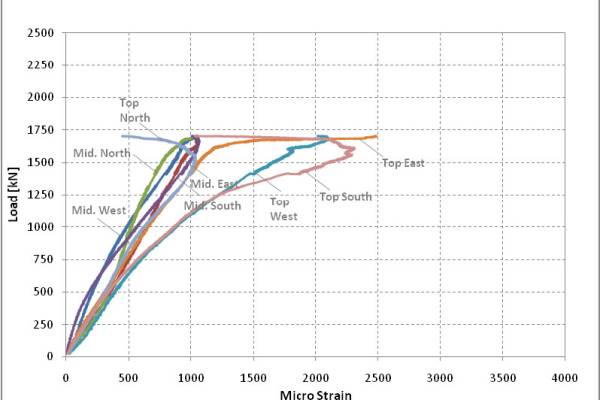
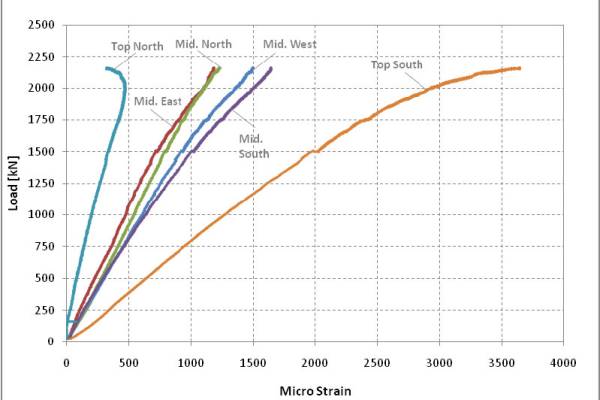
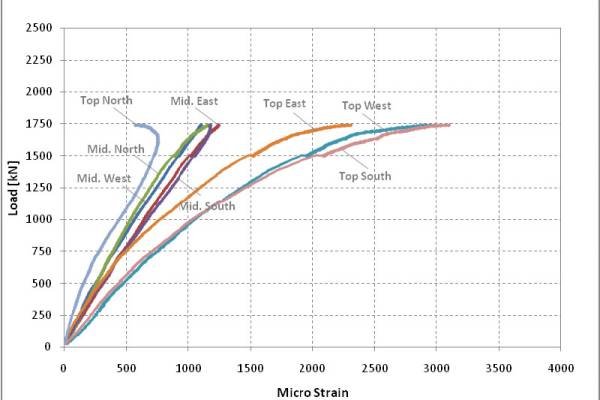
<align justify>Following graphs provide the results obtained from DAQ in each column test session. Figures E1 to E6 show the load versus strain curves for all columns at all available sensor attached to the specimen.</align>
See Also
Place text here.
